
OBERWEIS INTERNATIONAL OPPORTUNITIES INSTITUTIONAL FUND (OBIIX)
OBERWEIS FOCUSED INTERNATIONAL GROWTH FUND (OFIGX)
July 28, 2023
Dear Fellow Shareholder:
YEAR-TO-DATE PERFORMANCE THROUGH JUNE 30, 2023
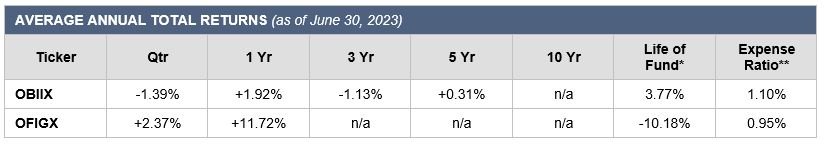
For the first six months of 2023, the Oberweis International Opportunities Institutional fund returned +3.66% vs. +5.72% for the benchmark, the MSCI World Ex USA Small Cap Growth Index. The Oberweis Focused International Growth Fund returned +13.24% vs. +11.67% for the MSCI EAFE Index.
MARKET ENVIRONMENT
Developed equity markets continued to do well during the second quarter. Equities have been strengthened by improved earnings expectations as well as macro data, in particular from the United States, that has been supportive of a soft-landing scenario. Both U.S. consumer confidence and durable goods orders exceeded expectations in May, while new home sales increased by 20% year-on-year despite the increase in mortgage rates. This data contrasts with the prevailing consensus narrative among pundits that the United States will soon lead the global economy into a severe recession. Furthermore, the improvement in inflation data has been positive for equity markets. Sticky-Price CPI, which is comprised of a basket of goods and services that reprice slowly and which represent more than 60% of the core index, peaked at over +8% in September when expressed on an annualized month-over-month basis. In May it was +4.1%, down from +4.7% in April. Moreover, rents are the biggest part of this indicator, and they rolled over last year, a dynamic that has largely yet to be reflected in the shelter index. In addition, the growth rate in U.S. average hourly earnings has been decelerating and the quit rate of service workers has declined. Services inflation, which has been central to the Fed’s view of price pressure, also fell further in May. For the first time in over a year, at its June meeting the Federal Reserve left interest rates alone. The yield curve has steepened from its low in February, with the market building in, at a minimum, a pause from the Central Bank after one more rate increase next month. However, Chairman Powell has explicitly suggested otherwise, stating that more rate hikes are likely this year.
Internationally, the inflation trends in the U.S. have been mirrored, with the portion of countries reporting large positive surprises in headline inflation continuing to decrease. Euro area headline inflation fell to +5.5% year-on-year in the June report, below consensus. Inflation in Spain and Switzerland even fell below 2%. Similarly, in Japan, the BOJ is forecasting easing core inflation after slower than expected increases in CPI in June. This was allied with its latest Tankan survey signaling faster business investment and increased production.
In the United States, neither consumers nor public companies went on borrowing binges over the last decade, and both refinanced long near the extraordinary bottom in rates. Consequently, the rate sensitivity of the economy is lower compared to prior cycles. The unemployment rate in the U.S. for June was 3.6%, near a five-decade low. Indeed, it has been below 4% for the longest stretch in 50 years and is now around 100bps below where it was when the tightening campaign started. As such, at this moment, the argument that higher rates will harm the labor market is hard to make. Indeed, if anything, the data to date suggests the economy is highly resilient. Moreover, as mentioned above, the recent trends in inflation point to slowing inflation. A continuing combination of disinflation and healthy demand lowers the odds of an economic downturn and is likely a friendly environment for equities.
A concern with an aggressive Fed is the impact on the banking sector, where the mini-financial crisis last spring could still foreshadow larger issues to come. In particular, commercial real estate looks vulnerable with significant refinancing needs (more than 40% of bank loans maturing this year and next). The cost of this refinancing is now above the rate embedded in the stock. Until now, there have been few non-performers in the banks’ commercial real estate loan books, but it may be that credit problems could worsen, even if set against a benign economic climate. Per above, the recent economic data has lent support to the soft-landing scenario, an outcome that would reduce the odds of a credit cycle.
Internationally, it is hard to find many strategists who have much that is positive to say on Europe, making the consensus opinion quite bearish on the region. However, Empirical Research Partners, who we have found to be among the best market strategists, have an overweight on Continental Europe . Notably, energy prices in Europe are down year-on-year, which contributes to input price deflation in the Eurozone and enables higher margins. Overall, the drags from input costs, inventories and capital spending appear to be easing in the developed world, resulting in improving margins of the core market (i.e. ex-commodities). As a result, we expect earnings to move higher over time within our investible universe.
In Japan, a series of corporate governance reforms announced by the Tokyo Stock Exchange encourages listed companies to create a plan to improve capital efficiency. Furthermore, the expansive monetary policy of the Bank of Japan, which started under Shinzo Abe, has continued in Kazuo Ueda’s term. Last but not least, Japan is emerging as an alternative to China, a gateway to Asia where the rule of law is respected. All this is leading to significant capital flows into Japan, including investments by Warren Buffett.
Precisely because the fate of the economy remains difficult to diagnose, many investors and analysts tend to – in line with basic human nature – “err on the side of caution”, which means they err. They tend to over-focus on the negative rather than analyze the reward/risk in an emotionally unbiased fashion. For example, for six quarters in a row, investors have been expecting a global recession to happen in the next 12 months. This has turned out to be wrong. As a result, many investors miss out on attractive buying opportunities. In a research note in May of last year, Morgan Stanley forecasted that the S&P would fall to 3,400. It never did, yet meanwhile risk aversion rose markedly. Many market participants got spooked and sold equites near the lows or did not take advantage of the attractive entry points. Today the S&P sits well north of 4,000, with New York Federal Reserve President John Williams recently stating that he does not have a recession in his forecast.
VALUATION RECAP
Valuations for developed market equities outside of the US remain below-average with, for example, free cash flow yields for small cap stocks in developed markets still near historical highs:
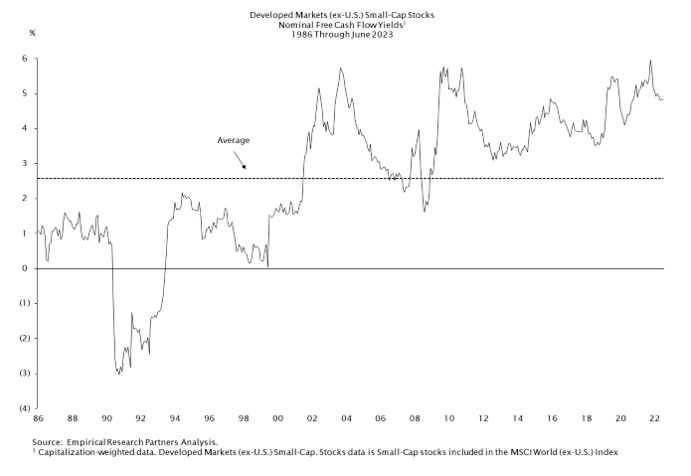
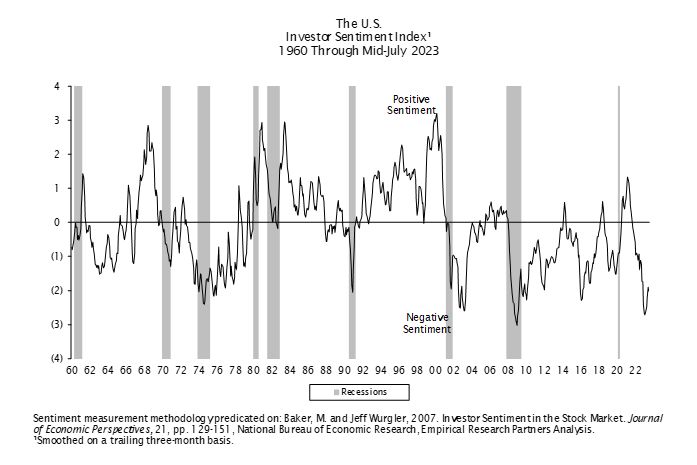
Further, investor sentiment and expectations for forward returns remain among the lowest they have ever been. Counter to common investor behavior, which tends to shy away from deploying new capital when consensus opinion becomes fearful, we have found that, historically, attractive valuations and near-trough expectations have generally made a favorable set-up for forward-looking long-term returns.
Our primary focus continues to be investing in strong companies with great underlying fundamentals, balance sheets and cash flows. Our holdings tend to be niche-oriented firms operating in disruptive markets. GDP matters, but it generally is not the main driver of long-term earnings growth. In that regard, our portfolio companies had in aggregate a solid set of earnings reports with strong underlying fundamentals. We are confident that whether the market goes up or down from here in the short-term, on a relative basis, the underlying fundamentals of our companies will continue to do well.
On behalf of the entire team at Oberweis, thank you for investing in the Oberweis Funds. If you have any questions about your account, please contact shareholder services at (800) 245-7311.
1 Strategy update with Mike Goldstein, Chief Strategist, Empirical Research Partners, June 29th, 2023. Page 7.
Sincerely,

James W. Oberweis, CFA – President Ralf Scherschmidt – Portfolio Manager
For current performance information, please visit www.oberweisfunds.com.
Performance data shown represents past performance and is no guarantee of future results. Investment return and principal value will fluctuate, so that you may have gain or loss when shares are sold. Current performance may be higher or lower than quoted. Unusually high returns may not be sustainable. Visit us online at oberweisfunds.com for most recent month-end performance.
The Oberweis Funds invest in rapidly growing smaller and medium sized companies which may offer greater return potential. However, these investments often involve greater risks and volatility. Foreign investments involve greater risks than U.S investments, including political and economic risks and the risk of currency fluctuations. There is no guarantee that the funds can achieve their objectives. Holdings in the Funds are subject to change.
Before investing, consider the fund’s investment objectives, risks, charges, and expenses. To obtain a copy of the prospectus or summary prospectus containing this and other information please visit our website at oberweisfunds.com or call 800-323-6166. Read it carefully before investing. The Oberweis Funds are distributed by Oberweis Securities, Inc. Member: FINRA & SIPC.
*Life of Fund returns are from commencement of operations on 03/10/14 for OBIIX and 4/1/22 for OFIGX.
** December 31, 2022. Expense ratio is the total net annualized fund operating expense ratio. The expense ratio gross of expense offset arrangements and expense reimbursements were 1.14% for OBIIX and 1.97% for OFIGX. Oberweis Asset Management, Inc. (OAM), the Fund’s investment advisor is contractually obligated through April 30, 2024 to reduce its management fees or reimburse OBIIX and OFIGX to the extent that total ordinary operating expenses exceed in any one year 1.10% and 0.95% expressed as a percentage of each Fund’s average daily net assets, respectively. Effective May 15, 2023, for OBIIX and OFIGX, respectively, the adviser may recoup the amount of any expenses reimbursed under the contract within three years following the date of the reimbursement if the recoupment does not cause the Fund’s expenses to exceed the expense limitation in place at the time of the recoupment, or the expense limitation in effect at the time of the initial reimbursement, whichever is lower.
The MSCI World ex-US Small Cap Growth Index (Net) is a free float-adjusted market capitalization weighted index that is designed to measure the equity market performance of small cap growth developed markets excluding the US, with minimum dividends reinvested net of withholding tax. The MSCI EAFE Index is an equity index that captures large and mid-cap representation across 21 developed markets countries around the world, excluding the U.S. and Canada. The index is comprehensive, covering approximately 85% of the free-float-adjusted market capitalization in each country.