
January 16, 2025
Dear Fellow Oberweis Funds Shareholder,
2024 PERFORMANCE IN REVIEW
Equity markets delivered significant gains in 2024. The investment environment turned out to be largely favorable — the feared recession did not occur, inflation slowed down (at least in the short term), and central banks began cutting interest rates. The spending boom in AI accelerated, causing mega-cap U.S. technology stocks to lead global market returns. Both in the U.S. and abroad, small-cap stocks underperformed large-cap stocks. U.S. equities outperformed those of developed international markets. Even with headwinds to some of the asset classes in which our funds invest, The Oberweis Funds still achieved a strong year.
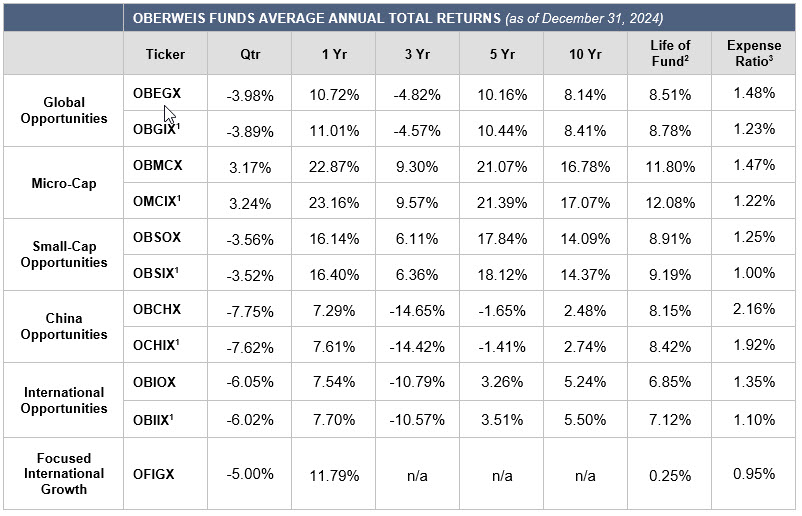
The Micro-Cap Fund returned 22.87% (based on investor-class returns) compared to 21.91% for the Russell Micro-Cap Growth Index. The Small-Cap Opportunities Fund returned 16.14% versus 15.15% for the Russell 2000 Growth Index. Both of these U.S.-focused funds have performed exceptionally well compared to their benchmarks over the trailing 3-, 5-, and 10-year measurement periods. For example, over the last 10 years, the average annual return of the Micro-Cap Fund was 16.78% compared to 5.30% for the index. Similarly, the Small-Cap Opportunities Fund returned 14.09% versus 8.09% for its benchmark over the same period.
International Opportunities returned 7.54% compared to 2.57% for the MSCI World ex-US SCG Net Index, for an outperformance of 497 basis points on the year. Over the last 15 years, the International Opportunities Fund has outperformed its benchmark by 252 basis points annually (net of fees). In 2024, the China Opportunities Fund returned 7.29% compared to 19.42% for the MSCI China Index. While it underperformed in 2024, this fund has exceeded its benchmark over the trailing 5-, 10-, and 15-year periods. Global Opportunities gained 10.72% versus 7.66% for the MSCI ACWI Small-Cap Index, outperforming by 306 basis points for the year. This fund has also exceeded its benchmark over trailing 5-, 10- and 15-year periods. The Focused International Growth Fund returned 11.79% versus 3.82% for the MSCI EAFE Index, for a large outperformance of 797 basis points.
OUTLOOK
With 30 years of equity investment experience under my belt, I have thought a lot about what I can teach my children about investing to help them over the long term. One of the first lessons that comes to mind is that investment cycles can be long and tortuous, but patience, discipline and independent thinking pay off. When I started in the business in 1995, it was the beginning of the Internet boom. By 1999, growth stocks had beaten value stocks by so much that value investing’s obituary had already been written, only to be resurrected in the aftermath of the dotcom bust. From 2001 to 2008, value stocks regained the throne. And after that, leadership shifted once again. For much of the last 15 years, especially in the last decade, U.S. large-cap technology stocks have trounced nearly everything else.
In each of these cycles, at their peak, one could observe obvious and quantitatively measurable gaps between valuations at the time and their historical norms, particularly when compared to those of other asset classes. Still, euphoria and FOMO take over, with very few really paying attention to the risks and opportunities. It’s so hard for investors to watch something work for 5, 10 or even 15 years and simultaneously recognize that the pattern will invariably change. But ironically, the risks of NOT shifting sharply increase as the assumptions of the cycle’s perpetuation become engrained. Market returns are not randomly distributed. As valuations increase to their outermost historical bounds, the risk of future underperformance increases, especially when measured over longer future periods like the next decade. Still, we are slaves to near-term pattern recognition and cognitive biases, and many investors will stick with whatever has worked well most recently, despite quantitative evidence that highlights the risk.
In each cycle, there is usually a rational explanation behind the leaders. Most recently, one might convincingly argue that advances in artificial intelligence will improve productivity, expand margins and justify higher-than-average valuations over time, similar to the story we heard prior to the dotcom bust. The U.S. is the global leader in A.I. and also boasts an efficient capital allocation system that works well during periods of explosive innovation. This is all true. But at SOME price, the investment thesis still fails. At some price, U.S. small-cap stocks and European stocks are better investments than U.S. mega-caps, even if those companies are better managed, more profitable, and faster growing. At some price, small-cap stocks will be extremely likely to outperform their larger counterparts, no matter how great the “Magnificent Seven” actually execute. Nobody knows what that price is, but historically, it is often dangerous to chase an asset class after a decade of leadership, especially when the valuation gap between the leading asset class and alternatives approaches historical highs. We believe that is indeed the case today, both for small-cap stocks and left-for-dead international equities, which trade for markedly lower valuations than U.S. mega-caps. The lesson I would give to my kids is this: Don’t chase the crowd. Rebalance annually to a consistent asset allocation or perhaps even be a contrarian when valuation disparities approach extremes, as they are today.
VALUATION RECAP
As of December 31, 2024, the price/earnings (P/E) ratio was 16.3 times for the Global Opportunities Fund (versus 17.5 last quarter), 18.7 times for the Small-Cap Opportunities Fund (versus 20.0 last quarter), 17.3 times for the Micro-Cap Fund (versus 16.5 last quarter), 15.5 times for the International Opportunities Fund (versus 15.7 last quarter), 12.7 times for the China Opportunities Fund (versus 13.7 last quarter), and 16.6 times for the Focused International Growth Fund (versus 14.1 last quarter). Each of these funds invests in companies with expected earnings growth rates that are higher than that of the broader market, and in companies expected to grow faster than current market expectations. As of December 31, 2024, the weighted-average market capitalization was $6.4 billion for the Global Opportunities Fund, $6.8 billion for the Small-Cap Opportunities Fund, $2.0 billion for the Micro-Cap Fund, $6.4 billion for the International Opportunities Fund, $154.5 billion for the China Opportunities Fund, and $123.0 billion for the Focused International Growth Fund.
We appreciate your investment in The Oberweis Funds and are grateful for the trust you have shown us with your valuable investments. If you have any questions about your account, please contact shareholder services at (800) 245-7311. Thank you for investing with us in The Oberweis Funds.
Sincerely,

James W. Oberweis, CFA
President & Portfolio Manager
MANAGEMENT DISCUSSION ON FUND PERFORMANCE
MARKET ENVIRONMENT
Global equities returned 18.67% in 2024, as measured by the MSCI World Index. Global small-caps, as measured by the MSCI World Small-Cap Index, returned 8.15%, underperforming large-capitalization stocks. International small-caps underperformed U.S. small-caps for the seventh year, as evidenced by the 2.76% return on the MSCI World ex-USA Small-Cap Index. Within the United States, small-cap growth stocks underperformed large-cap growth stocks by 1,821 basis points, as measured by the respective returns of the Russell 2000 Growth (15.15%) and Russell 1000 Growth (33.36%) indices. Growth stocks significantly outperformed value stocks globally in 2024, with the MSCI World Growth Index (25.92%) returning 1,445 basis points more than the MSCI World Value Index (11.47%). Similarly, small-cap growth stocks outperformed small-cap value stocks, with the MSCI World Small-Cap Growth Index returning 8.19% versus 4.67% for the MSCI World Small-Cap Value Index. Within domestic small-cap, the Russell 2000 Growth Index (15.15%) outperformed the Russell 2000 Value Index (8.05%) by 710 basis points for the year.
DISCUSSION OF THE OBERWEIS FUNDS
The Micro-Cap Fund returned 22.87% versus 21.91% for the Russell Micro-Cap Growth Index. The portfolio benefitted from favorable stock selection in healthcare, industrials, and consumer discretionary while technology detracted from relative performance, primarily due to our underweight position in the sector. At the stock level, ADMA Biologics (ADMA), Primoris Services (PRIM), and American Superconductor (AMSC) were among the top contributors to performance. Aehr Test Systems (AEHR), Navitas Semiconductor (NVTS), and Alphatec (ATEC) were among the top detractors. OBMCX Holdings
The Small-Cap Opportunities Fund returned 16.14% versus 15.15% for the Russell 2000 Growth Index. The portfolio benefitted from favorable stock selection in industrials, consumer discretionary, and materials. Credo Technology (CRDO), Super Micro Computer (SMCI), and Zeta Global (ZETA) were among the top contributors to performance. Aehr Test Systems (AEHR), Tidewater (TDW), and Axcelis Technologies (ACLS) were among the top detractors. OBSOX Holdings
The International Opportunities Fund returned 7.54% versus 2.57% for the MSCI World ex-US Small Cap Growth Index. At the country level, Japan, Norway, and Switzerland were the leading contributors to portfolio performance while Canada, Finland, and Denmark were the leading detractors. At the sector level, the portfolio was positively impacted by stock selection in industrials and consumer discretionary, while materials and energy detracted from performance. At the stock level, Kongsberg (KOG NO), Asics (7936 JP), and Fujikura (5803 JP) were among the top contributors to performance; ATS (ATS CN), ULVAC (6728 JP), and James Hardie Industries (JHX AU) were among the top detractors. OBIOX Holdings
The Global Opportunities Fund returned 10.72% versus 7.66% for the MSCI AWCI Small-Cap Index. At the country level, stock selection in Japan, Switzerland, and the United Kingdom added to portfolio return, while Canada, the United States, and Israel detracted from portfolio return. At the sector level, consumer discretionary, industrials, and materials added to return, while healthcare, financials, and communication services detracted. At the stock level Credo Technology (CRDO US), Asics (7936 JP), and Zeta Global (ZETA US) were among the top contributors to performance; Alphatec (ATEC US), Axcelis Technologies (ACLS US), and ACM Research (ACMR US) were among the top detractors. OBEGX Holdings
The China Opportunities Fund returned 7.29% versus 19.42% for the MSCI China Index. At the sector level, consumer discretionary, industrials, and healthcare contributed to performance while technology, financials, and communication services were top detractors. At the stock level, Taiwan Semiconductor Manufacturing Co. (TSM US), Pop Mart International (9992 HK), and Meituan (3690 HK) were among the top contributors to performance; Pinduoduo (PDD US), Li Auto (LI US), and China Resources Mixc Lifestyle Services (1209 HK) were among the top detractors. OBCHX Holdings
The Focused International Growth Fund returned 11.79% versus 3.82% for the MSCI EAFE Index. At the country level, Germany, the U.K., and Italy were the top contributors, while Australia, Singapore, and Israel detracted from portfolio return. At the sector level, industrials, technology, and consumer staples added to return, while financials, communication services, and energy detracted. At the stock level, Hitachi (6501 JP), SAP (SAP GR), and Rolls-Royce (RR/ LN) were among the top contributors to performance; LVMH (MC FP), BHP (BHP AU) and Sony (6758 JP) were among the top detractors. OFIGX Holdings
For current performance information, please visit www.oberweisfunds.com
Performance data shown represents past performance and is no guarantee of future results. Investment return and principal value will fluctuate, so that you may have gain or loss when shares are sold. Current performance may be higher or lower than quoted. Unusually high returns may not be sustainable. Visit us online at oberweisfunds.com for most recent month-end performance.
The Oberweis Funds invest in rapidly growing smaller and medium sized companies which may offer greater return potential. However, these investments often involve greater risks and volatility. Foreign investments involve greater risks than U.S investments, including political and economic risks and the risk of currency fluctuations. There is no guarantee that the funds can achieve their objectives. Holdings in the Funds are subject to change.
Before investing, consider the fund’s investment objectives, risks, charges, and expenses. To obtain a copy of the prospectus or summary prospectus containing this and other information please visit our website at oberweisfunds.com or call 800-323-6166. Read it carefully before investing. The Oberweis Funds are distributed by Oberweis Securities, Inc. Member: FINRA & SIPC.
1Institutional Class shares OBGIX, OMCIX, OBSIX and OCHIX performance information was calculated using the historical performance of Investor Class shares for periods prior to May 1, 2017. Institutional Class shares OBIIX performance information was calculated using the historical performance of Investor Class shares for periods prior to December 26, 2023.
22Life of Fund returns are from commencement of operations on 01/07/87 for OBEGX, 01/01/96 for OBMCX, 09/15/96 for OBSOX, 10/01/05 for OBCHX, 02/01/07 for OBIOX, and 04/01/22 for OFGIX. Inception for the Institutional Class shares of OBGIX, OMCIX, OBSIX, and OCHIX is 05/01/17 and for OBIIX is 12/26/23.
33 December 31, 2024 data. Expense ratio is the total net annualized fund operating expense ratio. The expense ratio gross of expense offset arrangements and expense reimbursements was 1.48%, 1.23%, 1.47%, 1.22%, 1.26%, 1.01%, 2.16%, 1.92%, 1.45%,1.20% and 2.37% for OBEGX, OBGIX, OBMCX, OMCIX, OBSOX, OBSIX, OBCHX, OCHIX, OBIOX, OBIIX and OFIGX respectively. Oberweis Asset Management, Inc. (OAM), the Fund’s investment advisor is contractually obligated through April 30, 2025 to reduce its management fees or reimburse OBEGX and OBMCX to the extent that total ordinary operating expenses, as defined, exceed in any one year the following amounts expressed as a percentage of each Fund’s average daily net assets: 1.8% of the first $50 million; plus 1.6% of average daily net assets in excess of $50 million and for OBGIX and OMCIX 1.55% of the first $50 million; plus 1.35% of average daily net assets in excess of $50 million. OAM is also contractually obligated through April 30, 2025 to reduce its management fees or reimburse OBSOX, OBCHX, OBIOX and OFIGX to the extent that total ordinary operating expenses exceed in any one year 1.25%, 2.24%, 1.35% and 0.95% expressed as a percentage of each Fund’s average daily net assets, respectively, and for OBSIX, OCHIX and OBIIX 1.00%,1.99% and 1.10% respectively. Effective May 15, 2023, for OBCHX, OCHIX, OBIOX, OBIIX and OFIGX, respectively, the adviser may recoup the amount of any expenses reimbursed under the contract within three years following the date of the reimbursement if the recoupment does not cause the Fund’s expenses to exceed the expense limitation in place at the time of the recoupment, or the expense limitation in effect at the time of the initial reimbursement, whichever is lower.
The MSCI World ex-US Small Cap Growth Index (Net) is a free float-adjusted market capitalization weighted index that is designed to measure the equity market performance of small cap growth developed markets excluding the US, with minimum dividends reinvested net of withholding tax. The MSCI ACWI Small Cap Index (Net) is a free float-adjusted market capitalization weighted index that is designed to measure the equity market performance of small cap developed and emerging markets with dividends reinvested net of withholding tax. The MSCI China Net Index is a free float-adjusted market capitalization-weighted Index of Chinese equities that include China-affiliated corporations and H shares listed on the Hong Kong Exchange, and B shares listed on the Shanghai and Shenzhen exchanges and P chips and foreign listings with minimum dividends reinvested net of withholding tax. The MSCI EAFE Index is an equity index that captures large and mid-cap representation across 21 developed markets countries around the world, excluding the U.S. and Canada. The index is comprehensive, covering approximately 85% of the free-float-adjusted market capitalization in each country. You cannot invest directly in these indexes.
The Russell 2000 Index measures the performance of approximately 2,000 companies with small-market capitalizations. The Russell 2000 Growth Index measures the performance of those Russell 2000 companies with higher price-to-book ratios and higher forecasted earnings growth rates. The Russell Microcap Growth Index measures the performance of those Russell Micro Cap companies with higher price-to-book ratios and higher forecasted growth values. The performance data includes reinvested dividends. The Russell Microcap Index is represented by the smallest 1,000 securities in the small cap Russell 2000 Index plus the next 1,000 securities. Each index is an unmanaged group of stocks, whose performance does not reflect the deduction of fees, expenses or taxes. You cannot invest directly in these indexes.
P/E (Price/Earnings Ratio): This is a measure of valuation. It relates the price of the stock to the earnings per share (EPS) of the company. P/E Forward 4 Quarters: Refers to the forward price to earnings ratio estimated over the next 4 quarters. Long-Term Debt to Total Equity: Refers to dividing a company’s total liabilities by its
shareholder equity. Weighted Average Market Capitalization: This is a measure of the average market capitalization of the stocks within the portfolio, weighted by the amount of each stock owned.