Micro-Cap Growth

Objective

Realize a total return exceeding the Russell Microcap Growth Index over a full market cycle.

Investment Strategy

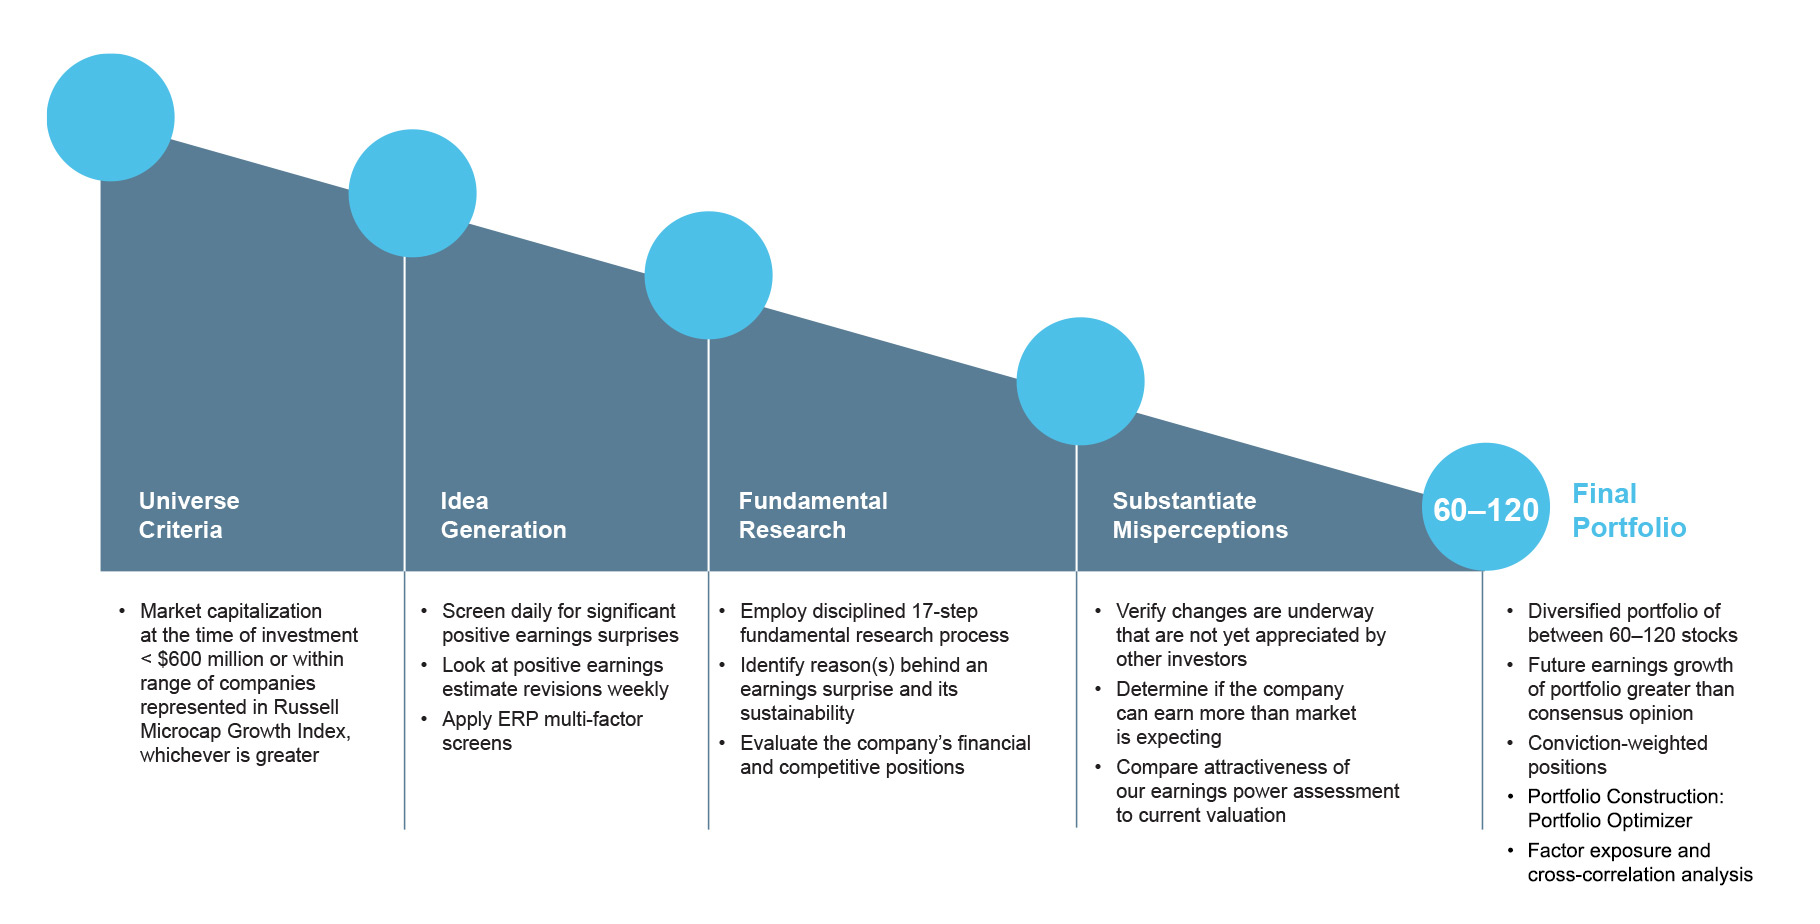
The Oberweis Micro-Cap Growth strategy seeks to capitalize on the exceptional growth potential of micro-cap companies that are often underfollowed or misunderstood by traditional Wall Street research analysts. The strategy invests in very small companies that, at the time of purchase, have a market capitalization of less than $600 million or are within the range of companies represented in the Russell Microcap Growth Index, whichever is greater. These companies often boast exciting products and/or services, a strong and sustainable competitive position, and the potential for upward revisions in earnings expectations in the future. Our fundamental research process is specifically designed to uncover such opportunities.

Benefits

  • Access to one of the least efficient segments of the equity market
  • Potential for significant alpha over a full market cycle
  • Disciplined and repeatable investment process managed by a passionate and experienced investment team
  • Fundamental research process specifically designed to uncover micro-cap companies that are underfollowed or misunderstood by traditional Wall Street research analysts
  • Exposure to micro-cap companies offering the potential for earnings growth that differs from consensus expectations
  • Diversified portfolio with a focus on risk management

Strategy Basics

INCEPTION
ASSETS IN STRATEGY
BENCHMARK
PORTFOLIO STATUS
MINIMUM INVESTMENT

1/1/1996

$475.3 million (As of 3/31/2024)

Russell Microcap® Growth Index

Strategy open to new investors

$5 million for separate account management


Our Process

Our process rests on our firmwide commitment to uncovering and capitalizing on the persistent and recurring stock pricing inefficiencies in global equities caused by a lag in investor response to new information. This lag in recognizing the catalysts likely to positively impact future earnings growth drives the security selection across all our strategies and mutual funds. The criteria used within each product, however, can differ. This is how our investment team implements our philosophy in the Micro-Cap Growth strategy.

For the Quarter Ended

See pricing for all funds

Performance

Calendar Years

Downloadable .xls Composite Returns on the Micro-Cap Growth Strategy

Downloadable .pdf GIPS® Compliant Annual Disclosure Presentation for the Micro-Cap Growth Strategy

*OAM Micro-Cap Composite inception date: 1/1/96

The Russell Microcap Growth Index measures the performance of those Russell Microcap companies with higher price-to-book ratios and higher forecasted growth values. The Russell Microcap Growth Index is represented by the smallest 1,000 securities in the small-cap Russell 2000 Index plus the next 1,000 securities. Each index is an unmanaged group of stocks, the performance of which does not reflect the deduction of fees, expenses, or taxes. You cannot invest directly in these indexes.

Net-of-fee composite returns are calculated using the highest model investment advisory fees applicable to portfolios within the composite. Advisory fees are disclosed in Part II of Form ADV. Performance is historical and includes the reinvestment of dividends and other income. Performance is calculated and presented in U.S. dollars. Past performance is not necessarily indicative of future results.

Oberweis Asset Management, Inc. (OAM) claims compliance with the Global Investment Performance Standards (GIPS® standards). To receive a complete list and description of OAM’s composites and/or a presentation that adheres to the GIPS standards, contact Laura Dombro at 800-323-6166; write Oberweis Asset Management, Inc., 3333 Warrenville Road, Suite 500, Lisle, IL 60532; or e-mail laura.dombro@oberweis.net.

For the Quarter Ended

OAM Micro-Cap Growth
Number of Stocks
Weighted Market Capitalization (millions)
Median Market Capitalization (millions)
P/E Forward 4 Quarters (estimated)
P/E Trailing 4 Quarters
Long-Term Future EPS Growth Rate (estimated)
2019 P/E to Growth Rate Ratio
2020 P/E to Growth Rate Ratio (estimated)
Dividend Yield
Price-to-Book Ratio
Price-to-Cash Flow Ratio
Price-to-Sales Ratio
Long-Term Debt to Total Equity
Return on Equity
Net Profit Margin
Cash Position
Portfolio Turnover (2018)

Source: Eikon

SECTOR ALLOCATION as of

Top 10 Holdings as a % of Total Net Assets

Portfolio holdings are subject to change at any time. References to specific securities should not be construed as a recommendation to buy or sell and should not be assumed profitable.

Top 10 Holdings as of

Source: Eikon

Invest Now