
April 16, 2024
Dear Fellow Oberweis Funds Shareholder,
FIRST QUARTER PERFORMANCE
Each of the Oberweis Funds experienced appreciation for the quarter and most exceeded their respective benchmarks as well. Small-Cap Opportunities gained 10.08% versus 7.58% for the Russell 2000 Growth Index. Micro-Cap returned 3.54% compared to 6.60% for the Russell Microcap Growth Index. Among the international funds, Focused International Growth returned 10.60% versus 5.78% for the MSCI EAFE Index, while International Opportunities returned 6.49% compared to 2.26% for the MSCI World ex-USA Small Cap Growth Index (net). Global Opportunities gained 4.03% versus 3.91% for the MSCI ACWI Small Cap Index. The Emerging Markets Fund returned 0.61% versus 1.05% for the MSCI EM Small Cap Index, and the China Opportunities Fund returned 1.22% compared to -2.19% for the MSCI China Index.
MARKET ENVIRONMENT
Throughout the quarter, investors reacted to new economic data points, seeking clues on the state of global inflation. Expectations tipped incrementally dovish in November and December, with many forecasting cuts to begin mid-2024. However, new data in the first quarter took steam out of that thesis. Against persistent inflation news, hopes of near-term rate cuts diminished and “higher for longer” returned to consensus. The U.S. 10-year treasury yield rose from 3.9% to 4.2% by the end of the first quarter and increased to 4.6% as of mid-April. With greater sensitivity to interest rates, small-caps lagged their larger-cap brethren. Higher US interest rates also drove a strong dollar, which tends to be a headwind for emerging markets.
The good news is that inflation has been stubbornly high because U.S. economic growth has been fairly strong. Corporate earnings remain resilient and signs point toward mounting momentum, but for most large-company stocks, valuations already reflect a lot of good news. Large-cap valuations (especially in tech) are materially above historical averages. On the other hand, small-caps remain more reasonably valued. The gap between large- and small-cap valuations is near a 30-year high. While cycles favoring large- or small-cap stocks can persist for many years, this cycle favoring large-caps has already been longer than average and math does eventually win out. Furthermore, the inflection point of the interest rate cycle has often triggered some of the best performance periods for small-cap growth stocks. It’s hard to tell how long high inflation will hang around, but it seems likely to decline eventually and, as a result of much lower valuations, we believe the odds of small-cap growth stocks outperforming large-caps over the next five years are high.
Outside the United States, economic activity has been less robust. Europe remains soft, but so are investor expectations, implying that even modest outperformance could surprise markets to the upside. In China, economic conditions are perhaps the worst of any major market, but are showing signs of marginal improvement from a low base and Chinese stock market valuations are exceptionally low.
Geopolitics remain a wildcard that could affect returns for the balance of the year. From the continuing war in Ukraine to US/China relations to conflict in the Middle East, a lot could still go wrong. On the other hand, many expect it will, so relative calm or even some sort of modest resolution could be a significant catalyst for international markets.
VALUATION RECAP
As of March 31, 2024, the price/earnings (P/E) ratio was 18.4 times for the Global Opportunities Fund (versus 13.8 last quarter), 19.1 times for the Small-Cap Opportunities Fund (versus 17.7 last quarter), 14.1 times for the Micro-Cap Fund (versus 14.1 last quarter), 15.4 times for the International Opportunities Fund (versus 16.5 last quarter), 15.7 times for the China Opportunities Fund (versus 14.9 last quarter), 15.3 times for the Emerging Markets Fund (versus 21.3 times last quarter), and 16.1 times for the Focused International Growth Fund (versus 14.6 last quarter). Each of these funds invests in companies with expected earnings growth rates that are higher than that of the broader market, and in companies expected to grow faster than current market expectations. As of March 31, 2024, the weighted-average market capitalization was $6.2 billion for the Global Opportunities Fund, $6.2 billion for the Small-Cap Opportunities Fund, $1.6 billion for the Micro-Cap Fund, $6.5 billion for the International Opportunities Fund, $4.6 billion for the Emerging Markets Fund, $88.1 billion for the China Opportunities Fund, and $148.0 billion for the Focused International Growth Fund.
We appreciate your investment in The Oberweis Funds and are grateful for the trust you have shown us with your valuable investments. If you have any questions about your account, please contact shareholder services at (800) 245-7311.
Thank you for investing with us in The Oberweis Funds.
Sincerely,

James W. Oberweis, CFA
President & Portfolio Manager
For current performance information, please visit www.oberweisfunds.com
Performance data shown represents past performance and is no guarantee of future results. Investment return and principal value will fluctuate, so that you may have gain or loss when shares are sold. Current performance may be higher or lower than quoted. Unusually high returns may not be sustainable. Visit us online at oberweisfunds.com for most recent month-end performance.
The Oberweis Funds invest in rapidly growing smaller and medium sized companies which may offer greater return potential. However, these investments often involve greater risks and volatility. Foreign investments involve greater risks than U.S investments, including political and economic risks and the risk of currency fluctuations. There is no guarantee that the funds can achieve their objectives. Holdings in the Funds are subject to change.
Before investing, consider the fund’s investment objectives, risks, charges, and expenses. To obtain a copy of the prospectus or summary prospectus containing this and other information please visit our website at oberweisfunds.com or call 800-323-6166. Read it carefully before investing. The Oberweis Funds are distributed by Oberweis Securities, Inc. Member: FINRA & SIPC.
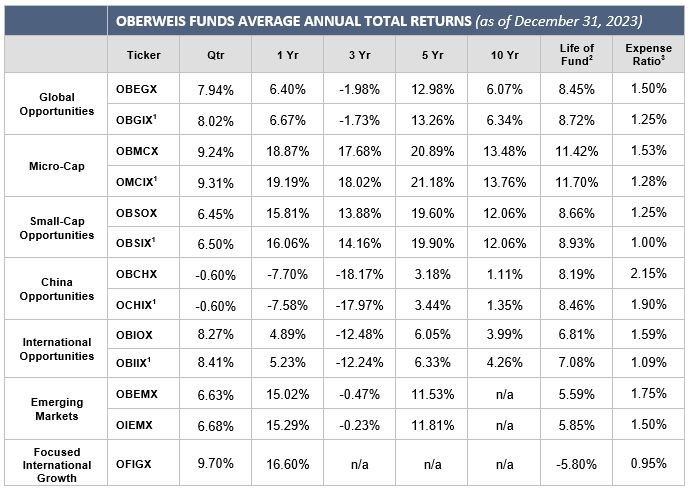
1Institutional Class shares OBGIX, OMCIX, OBSIX and OCHIX performance information was calculated using the historical performance of Investor Class shares for periods prior to May 1, 2017. Institutional Class shares OBIIX performance information was calculated using the historical performance of Investor Class shares for periods prior to December 26, 2023.
2Life of Fund returns are from commencement of operations on 01/07/87 for OBEGX, 01/01/96 for OBMCX, 09/15/96 for OBSOX, 10/01/05 for OBCHX, 02/01/07 for OBIOX, 05/01/18 for OBEMX/OIEMX and 04/01/22 for OFGIX. Inception for the Institutional Class shares of OBGIX, OMCIX, OBSIX, and OCHIX is 05/01/17 and for OBIIX is 12/26/23.
3December 31, 2023 data. Expense ratio is the total net annualized fund operating expense ratio. The expense ratio gross of expense offset arrangements and expense reimbursements was 1.51%, 1.25%, 1.53%, 1.28%, 1.32%, 1.07%, 2.16%, 1.90%, 1.92%,1.17%, 2.71%, 2.46% and 2.51% for OBEGX, OBGIX, OBMCX, OMCIX, OBSOX, OBSIX, OBCHX, OCHIX, OBIOX, OBIIX, OBEMX, OIEMX and OFIGX respectively. Oberweis Asset Management, Inc. (OAM), the Fund’s investment advisor is contractually obligated through April 30, 2025 to reduce its management fees or reimburse OBEGX and OBMCX to the extent that total ordinary operating expenses, as defined, exceed in any one year the following amounts expressed as a percentage of each Fund’s average daily net assets: 1.8% of the first $50 million; plus 1.6% of average daily net assets in excess of $50 million and for OBGIX and OMCIX 1.55% of the first $50 million; plus 1.35% of average daily net assets in excess of $50 million. OAM is also contractually obligated through April 30, 2025 to reduce its management fees or reimburse OBSOX, OBCHX, OBIOX, OBEMX and OFIGX to the extent that total ordinary operating expenses exceed in any one year 1.25%, 2.24%, 1.35%,1.75% and 0.95% expressed as a percentage of each Fund’s average daily net assets, respectively, and for OBSIX, OCHIX, OBIIX and OIEMX 1.00%,1.99%, 1.10% and 1.50% respectively. Effective May 15, 2023, for OBCHX, OCHIX, OBIOX, OBIIX, OBEMX, OIEMX and OFIGX, respectively, the adviser may recoup the amount of any expenses reimbursed under the contract within three years following the date of the reimbursement if the recoupment does not cause the Fund’s expenses to exceed the expense limitation in place at the time of the recoupment, or the expense limitation in effect at the time of the initial reimbursement, whichever is lower.
The MSCI World ex-US Small Cap Growth Index (Net) is a free float-adjusted market capitalization weighted index that is designed to measure the equity market performance of small cap growth developed markets excluding the US, with minimum dividends reinvested net of withholding tax. The MSCI ACWI Small Cap Index (Net) is a free float-adjusted market capitalization weighted index that is designed to measure the equity market performance of small cap developed and emerging markets with dividends reinvested net of withholding tax. The MSCI Emerging Markets Small Cap Index is a free float-adjusted, market capitalization-weighted index that measures the performance of small-cap stocks in 24 emerging markets. The MSCI China Net Index is a free float-adjusted market capitalization-weighted Index of Chinese equities that include China-affiliated corporations and H shares listed on the Hong Kong Exchange, and B shares listed on the Shanghai and Shenzhen exchanges and P chips and foreign listings with minimum dividends reinvested net of withholding tax. The MSCI EAFE Index is an equity index that captures large and mid-cap representation across 21 developed markets countries around the world, excluding the U.S. and Canada. The index is comprehensive, covering approximately 85% of the free-float-adjusted market capitalization in each country. You cannot invest directly in these indexes.
The Russell 2000 Index measures the performance of approximately 2,000 companies with small-market capitalizations. The Russell 2000 Growth Index measures the performance of those Russell 2000 companies with higher price-to-book ratios and higher forecasted earnings growth rates. The Russell Microcap Growth Index measures the performance of those Russell Micro Cap companies with higher price-to-book ratios and higher forecasted growth values. The performance data includes reinvested dividends. The Russell Microcap Index is represented by the smallest 1,000 securities in the small cap Russell 2000 Index plus the next 1,000 securities. Each index is an unmanaged group of stocks, whose performance does not reflect the deduction of fees, expenses or taxes. You cannot invest directly in these indexes.